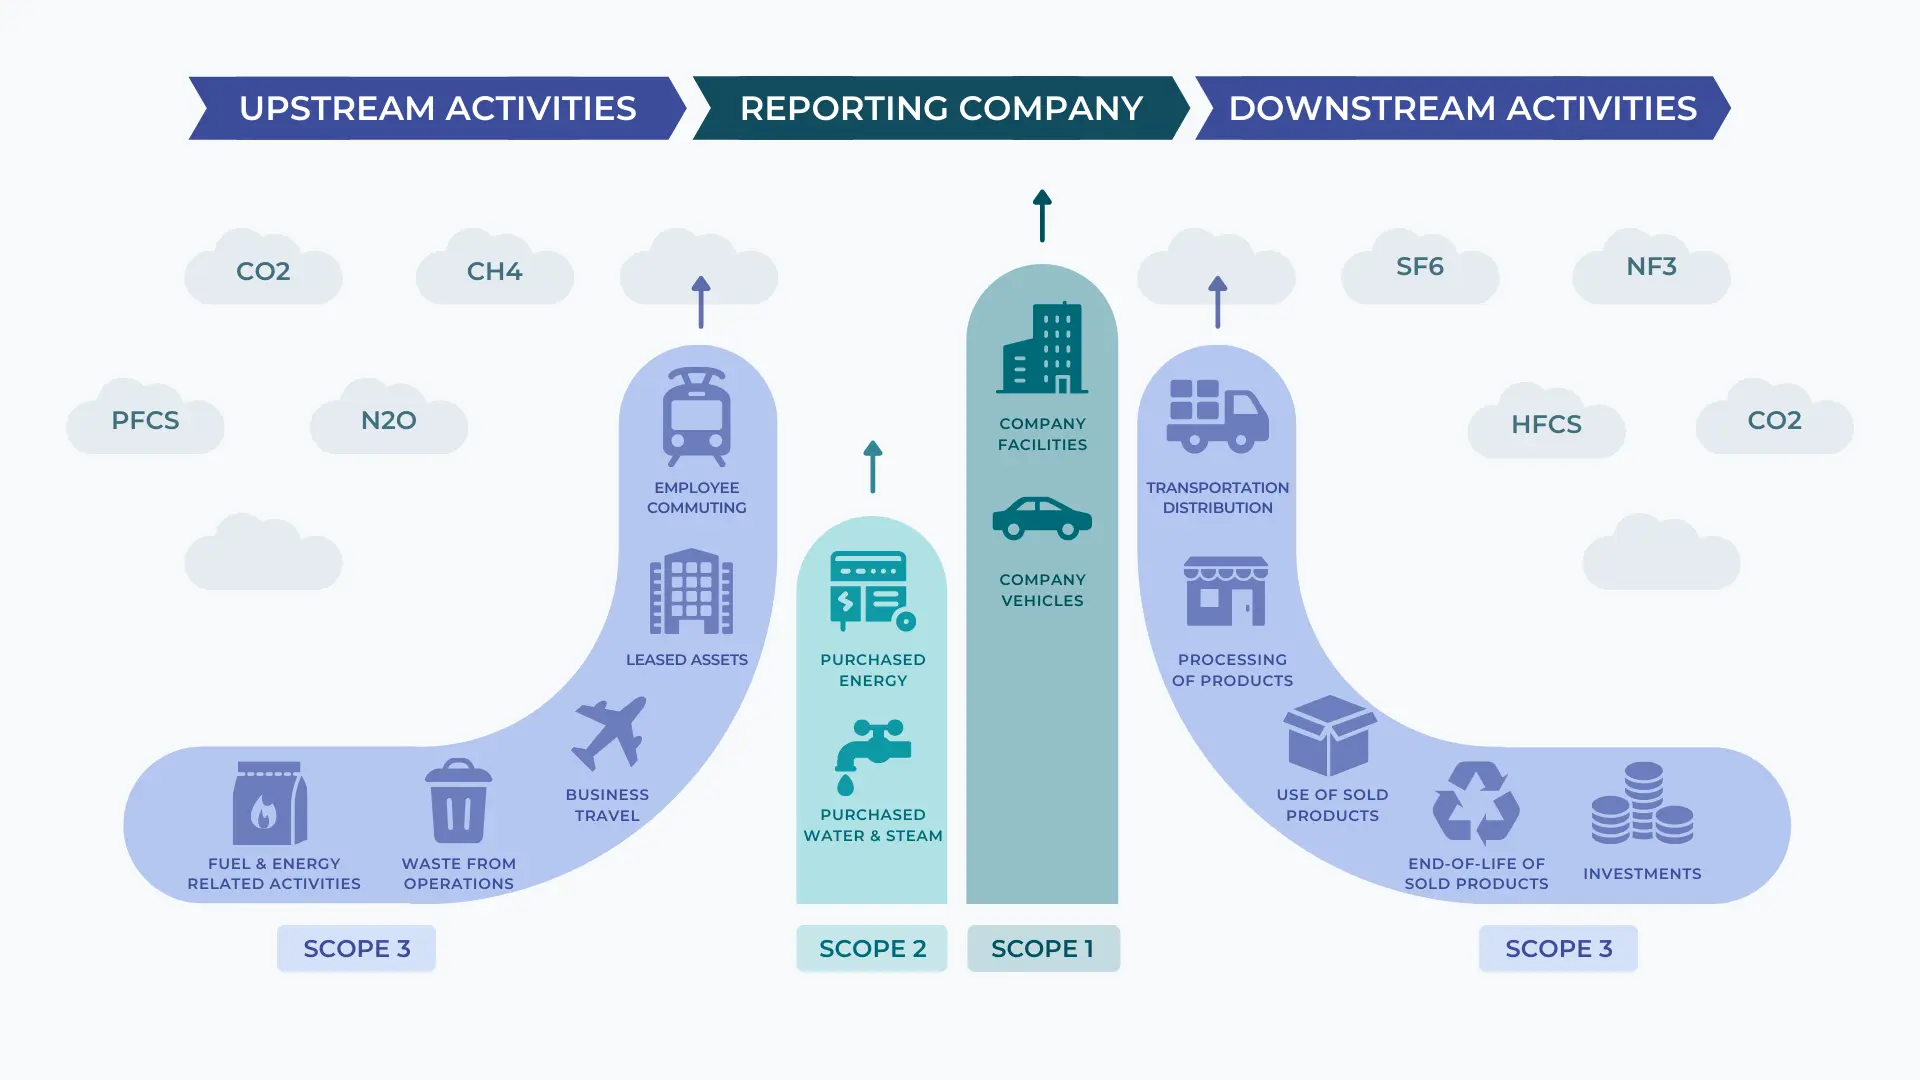
What is the extent of a carbon report?

The first step to make a carbon report is to define the extent of the latter; in other words, targeting and characterizing the possible sources of GHGs emission from the organization.

To do so, boundaries must be fixed beforehand by the reporting company.

Organizational boundaries

The organizational boundaries gather information about the control (operational or financial), ownership, legal agreements, joint ventures, etc., to be considered in the carbon report.

Defining the organizational perimeter can be a difficult task for complex organizations with, for example, shares in or control of another organization.

You can find out more about setting-up organizational boundaries by exploring the GHG Protocol Standard here.

Operational boundaries

The operational boundaries, as for them, gather information about the on-site and off-site activities, processes, services, and impacts to be considered in the carbon report.

The objective is to take into account all the sources of GHG emissions on which the company depends to carry out its activities (whether they are direct or indirect).

With these boundaries in mind, the accounting can begin. Emissions are then reported into 3 different scopes.

Scope 1

Scope 1
Direct GHG emissions

Direct emissions from sources owned or controlled by the organization, such as: combustion of stationary and mobile sources, non-combustion industrial processes, ruminant emissions, refrigerant leaks, etc.

Scope 2

Scope 2
Indirect energy emissions

Indirect emissions associated with the production of electricity, cooling, heat or steam imported for the organization’s operations.

Scope 3

Scope 3
Other indirect emissions

Other indirect emissions produced by the organization’s activities that are not accounted for in Scope 2 but which are related to the complete value chain such as: business travel, commuting, inputs, waste, inbound and outbound logistics, …

tapio-methodology-img3

Emissions categories

GHGs emissions from the three scopes are themselves divided into 23 categories, allowing a better tracking and identification of emissions hotspots.

Emissions drivers

To simplify the understanding and visualization of a carbon report, Tapio has created “emissions drivers” that regroup emissions sources by “sections”.

Sections are made by common attributes and the same levers of reduction for the related emissions sources, which are themselves customizable by the client. There are 7 drivers, click on the link below if you want to discover what sections and emissions sources our drivers gather.