Scope 3 categories explained: a complete guide for carbon reporting
Reading time: 6 minutes
Reading time: 6 minutes

Understanding and reporting your Scope 3 emissions is one of the most complex yet impactful steps in any carbon management journey. While Scope 1 and 2 emissions relate to activities under your direct control—such as on-site fuel combustion and purchased electricity—Scope 3 covers all indirect emissions from your value chain, upstream and downstream.
For businesses in Belgium, France, the Netherlands, Luxembourg, and the UK, regulatory frameworks like the CSRD and evolving stakeholder expectations make comprehensive carbon reporting essential. However, navigating the 15 Scope 3 categories defined by the GHG Protocol can be challenging without the proper guidance and tools.
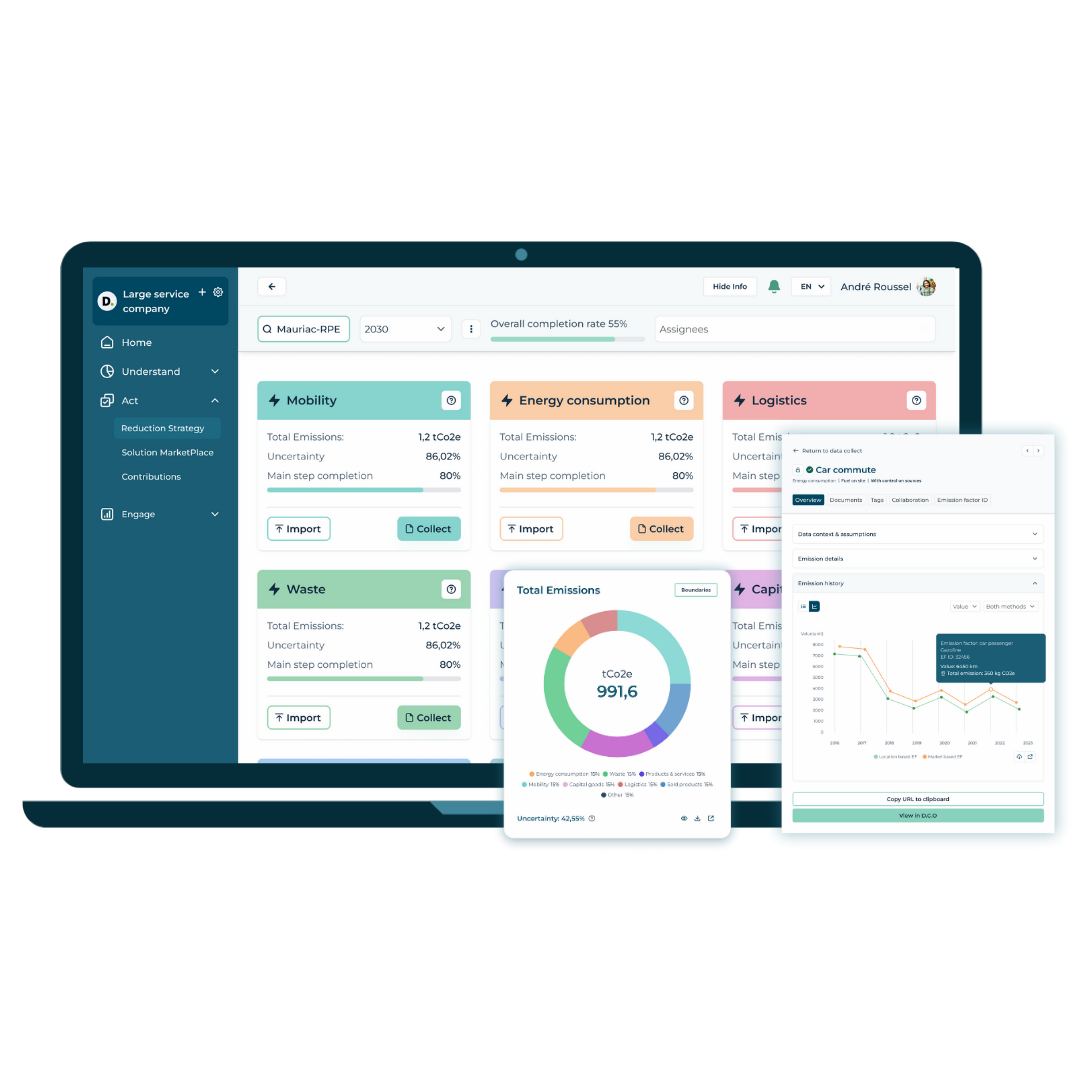
This article will break down each Scope 3 category, explain why they matter, and offer actionable data collection and reduction tips. You’ll also see how software like Tapio can help you streamline Scope 3 accounting—from supplier collaboration to data visualisation.
Scope 3 emissions are all indirect greenhouse gas emissions in a company’s value chain, excluding emissions covered in Scope 2 (purchased electricity, heat, or steam). These emissions often represent the largest share of a company’s carbon footprint—sometimes up to 90%.
In the EU, the Corporate Sustainability Reporting Directive (CSRD) drives mandatory reporting of value chain emissions. Meanwhile, SECR and TCFD disclosures are nudging companies towards full-scope transparency in the UK.
Stakeholders—including investors, clients, and regulators—now expect organisations to disclose and reduce Scope 3 emissions.
Not accounting for Scope 3 emissions can:
The 15 categories of Scope 3 emissions were defined by the GHG Protocol, a widely recognised international standard for greenhouse gas accounting. These categories provide a structured and consistent way for companies to identify and classify indirect emissions across their value chain. They help ensure nothing is overlooked and make comparing emissions across companies and sectors easier.
These categories are handy for carbon reporting because they:
Companies are not required to report on all 15 categories, only if they are relevant to their operations.
Covers emissions from the production of goods and services acquired by the company. This is often the largest category for many companies.
Example: A food manufacturer’s packaging materials and ingredients.
Emissions from producing long-term assets such as machinery, buildings, or vehicles.
Example: Emissions from constructing a new warehouse.
Emissions related to the extraction, production, and transportation of fuels and energy purchased by the company (not included in Scope 1 or 2).
Covers the emissions from third-party logistics providers and warehouses.
Emissions from third-party waste treatment and disposal.
Example: Organic waste sent to a landfill from a food plant.
Emissions from travel paid for by the company (flights, trains, hotels).
Covers daily travel between employees’ homes and the workplace.
Example: Emissions from private cars or public transport.
Emissions from assets leased by the company but not included in Scope 1 and 2.
Example: Rented office buildings or equipment.
Emissions from transporting and storing sold products between the company and end users.
Emissions from processing intermediate products sold to customers.
Example: A chemical company’s input is used by another firm.
Covers emissions from the use phase of products.
Example: A home appliance’s electricity use over its lifetime.
Emissions from the disposal and treatment of products after customer use.
Assets owned by the company but leased to others.
Example: A car rental company’s fleet is used by clients.
Emissions from franchise operations that aren’t owned by the company.
Emissions associated with other companies’ investments are relevant to financial institutions and investment firms.
One of the most common challenges when reporting Scope 3 emissions is the lack of accurate, primary data. Many activities that fall under Scope 3—like manufacturing purchased goods or using sold products—happen outside the company’s direct control. Suppliers might not provide emission data, product usage patterns can be challenging to estimate, and detailed life cycle assessments are often unavailable or expensive.
Given these limitations, companies need to balance ambition with pragmatism. The GHG Protocol recommends prioritising categories based on:
For example, a retailer may focus first on Categories 1 and 11 (purchased goods and product use), while a consultancy may prioritise business travel and employee commuting. Platforms like Tapio help companies visualise data coverage, identify gaps, and gradually build a roadmap to improve data quality over time.
Collecting data for Scope 3 emissions means working with internal departments and external stakeholders such as suppliers, clients, and logistics providers. Many companies start with spend-based estimates, using financial data and generic emission factors, and progressively refine their approach as more accurate activity data becomes available.
Supplier engagement is often the key to better data. Companies can share standardised questionnaires, request emissions data from critical suppliers, or use collaborative tools to streamline the process. It’s also essential to document the assumptions behind each calculation. Tools like Tapio allow teams to store source references, emission factors, and methodological notes directly on the platform.
Rather than trying to collect perfect data from the start, companies can take an iterative approach—starting with the most material categories, then deepening their understanding year after year.
The Bilan Carbone methodology, developed by ADEME and widely used in France, also aligns with the GHG Protocol. While the Bilan Carbone does not use the same 15-category structure, it covers the same value chain emissions through a different lens—focusing more on activity types and organisational context.
For example, upstream goods, energy, transport, and waste are present in both methods, though grouped differently. Bilan Carbone also emphasises factors specific to the French context, such as emission factors from the national database and certain regulatory expectations.
For companies working across borders, it’s helpful to know that data collected for one methodology can often be reused or adapted for another. Tapio supports GHG Protocol and Bilan Carbone logic, helping users bridge the gap and comply with national and international standards.
Scope 3 reporting is no longer optional—it’s central to achieving real carbon reductions and meeting stakeholder expectations. From supplier emissions to product usage and end-of-life, these categories demand attention, structure, and action.
New regulations and standards are fast-tracking Scope 3 disclosure for companies in Belgium, France, the Netherlands, Luxembourg, and the UK. Platforms like Tapio offer an all-in-one solution to manage the complexity, helping consultants and sustainability teams move from estimation to action.
Ready to get your Scope 3 reporting on track? Tapio can help you every step of the way.
Tapio is a carbon management software that allows companies and consultants to calculate and reduce carbon emissions.
What are the 15 Scope 3 categories?
They include all indirect upstream and downstream emissions, such as purchased goods, business travel, product use, and waste disposal.
How do I start calculating Scope 3 emissions?
Begin by identifying relevant categories, then choose a calculation method (spend-, activity-, or hybrid-based) and collect available data.
What’s the difference between Scope 2 and Scope 3?
Scope 2 refers to purchased electricity. Scope 3 covers other indirect emissions in your value chain.
Do I need to report all 15 categories?
No, only those relevant to your operations—but you must justify exclusions in line with GHG Protocol.
How can software help with Scope 3 reporting?
Software like Tapio improves data accuracy, supports collaboration, and offers real-time visuals and reduction modelling.