How to calculate the carbon footprint of a company
Reading time: 10 minutes
Reading time: 10 minutes
Measuring the carbon footprint of your company is becoming a business necessity. Reporting greenhouse gas (GHG) emissions is no longer optional for all companies.
The EU Corporate Sustainability Reporting Directive (CSRD) and similar frameworks in the UK require companies to disclose their emissions—especially Scope 1, 2 and material Scope 3. In addition to compliance, measuring your carbon footprint helps you:
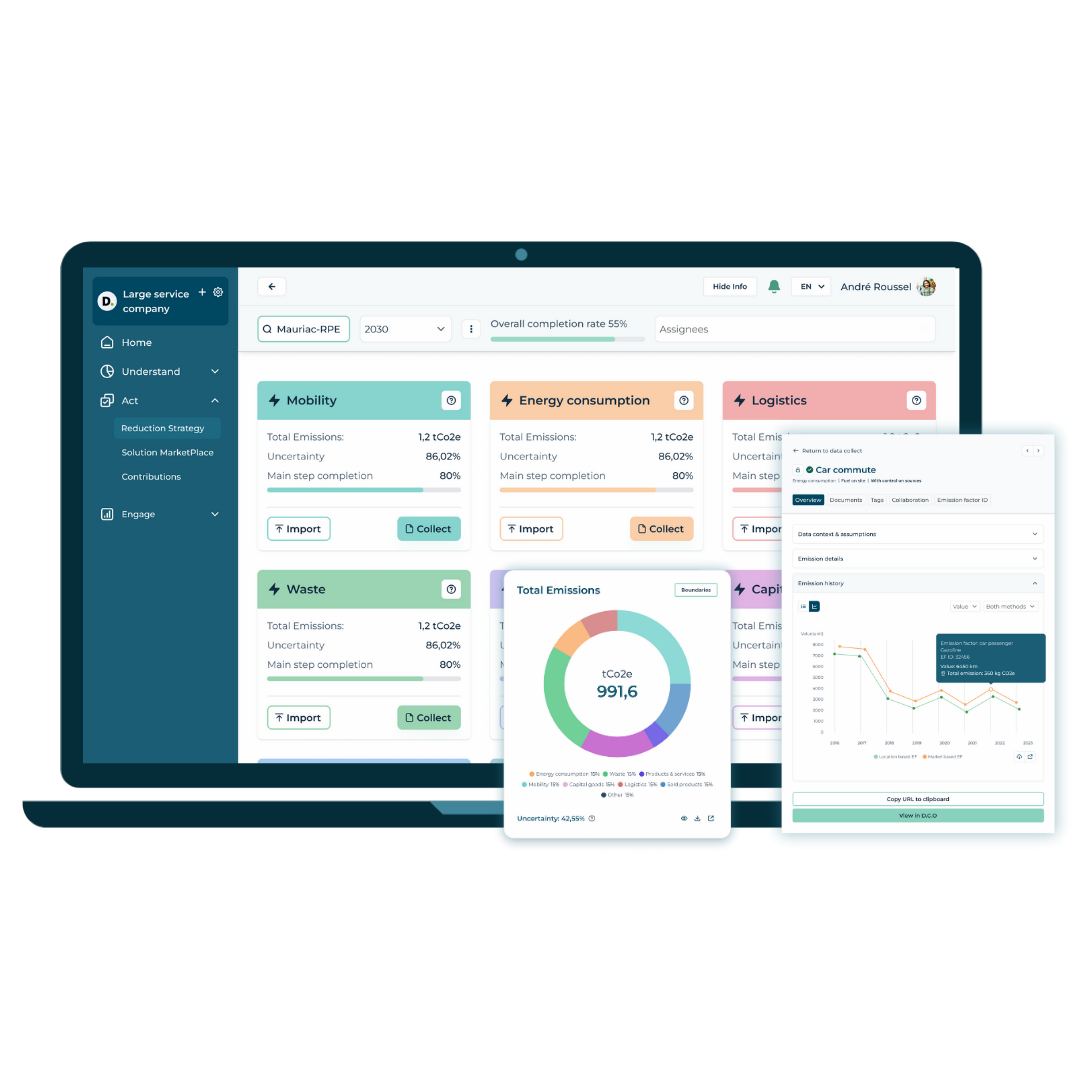
Using a dedicated carbon management software like Tapio makes this process easier. Tapio allows you to collaborate on data collection, manage user access across departments, and keep your process structured with features like the site tree view.
The two most widely used frameworks for calculating a company’s carbon footprint are:
These frameworks provide a solid foundation to structure your footprint and ensure consistency over time.
Calculating your carbon footprint involves six essential steps:
Start by deciding which entities, sites and subsidiaries are part of your footprint. Most companies use the operational control approach. With Tapio, you can easily visualise your company structure through the site tree view, ensuring all parts of your business are included.
Next, identify all relevant sources of emissions across:
This mapping exercise is the foundation of your carbon assessment.
This step is often the most time-consuming. You’ll need to gather data such as:
Some data is activity-based (e.g. kWh, litres), while other data may be spend-based (e.g. € spent). Tapio helps you structure data collection by allowing team members to collaborate directly on the platform, with clear user access levels and real-time progress tracking.
Tips to stay organised:
Use the basic formula:
Activity data × Emission factor = Emissions (in CO₂e)
An emission factor represents the average emissions per unit of activity (e.g. kg CO₂ per kWh). Tapio includes an extensive, built-in database of more than 2,500 emission factors, so you don’t need to search for them yourself.
You can run a market-based or location-based calculation, depending on whether you want to account for renewable energy purchases or average grid emissions. Tapio lets you compare both approaches in one click.
Once your emissions are calculated, review them carefully. Tapio includes data quality visualisation, so you can easily see where your data is strong and where improvements are needed. This helps you prioritise next steps and increase accuracy over time.
Prepare your results in a format aligned with reporting requirements (e.g., CSRD, internal ESG reports, CDP, Ecovadis). With Tapio, you can export clear, structured results and track your progress year over year.
Tapio’s carbon management software is designed for consultants and in-house teams working with medium and large companies. Features include:
Tapio makes carbon reporting faster, clearer, and more accurate—especially when multiple people or departments are involved.
Once your emissions are calculated, here’s what to do next:
With Tapio, you can calculate, track, and reduce your emissions over time, making carbon management part of your long-term strategy.
Calculating the carbon footprint of a company gives you the clarity to act. Whether you’re meeting CSRD requirements, reporting to CDP, or improving internal sustainability, the process follows a clear structure—from setting boundaries to collecting data and publishing results.
Using Tapio’s carbon management software streamlines the process from start to finish. With features like collaboration tools, site tree structure, data quality visualisation, and an emission factor database, Tapio makes carbon reporting not only easier—but also more reliable.
Once you’ve calculated your emissions, the next step is to reduce them. Tapio helps you track progress, engage your teams, and share results with stakeholders transparently. Start now and turn carbon reporting into a strategic tool for your company’s future.
Tapio is a carbon management software that allows companies and consultants to calculate and reduce carbon emissions.
Q1: How do I collect all the data I need for carbon reporting?
Use a structured approach by assigning data collection roles per site or department. Tapio’s collaborative interface helps track who’s responsible and what’s missing.
Q2: Is it okay to use spend-based data?
Yes, especially when activity-based data isn’t available. Tapio supports both methods and helps you improve data accuracy over time.
Q3: How do I find emission factors for my activities?
Tapio’s platform includes over 2,500 emission factors, including electricity, transport, materials and more—no need to search for them yourself.
Q4: Can I report both market-based and location-based emissions?
Yes. Tapio lets you choose and compare both methods so you can align with different reporting requirements.
Q5: How do I know if my data is good enough?
Tapio visualises data quality across all categories, helping you identify weak spots and prioritise improvements.